
The reliability basics are similar to any other parallel philosophies, such as Reliability Centered Maintenance (RCM), Total Productive Maintenance (TPM), Total Quality Management (TQM), reliability engineering or Six Sigma. Our ROM philosophy is continuously updated with all new reliability and maintenance management discoveries. Our management consultants shy away from jumping on the latest trend philosophy, since many of the new philosophies still return to the same basics previously discovered.

The bathtub curve is widely used in reliability engineering, although the general concept is also applicable to humans. It describes a particular form of the hazard function which comprises three parts:
The first part is a decreasing failure rate, known as early failures.
The second part is a constant failure rate, known as random failures.
The third part is an increasing failure rate, known as wear-out failures.
In practice, the Mean Time Between Failures (MTBF) is often used instead of the failure rate. The MTBF is an important system parameter in systems where failure rate needs to be managed, in particular for safety systems. The MTBF appears frequently in the engineering design requirements, and governs frequency of required system maintenance and inspections. In special processes called renewal processes, where the time to recover from failure can be neglected and the likelihood of failure remains constant with respect to time, the failure rate is simply the multiplicative inverse of the MTBF.
Preventive maintenance (PM) is often set up in a very inefficient way. It is typical to see that the PM program is work order driven instead of route driven. Many PM tasks are still done while equipment is down because this was how it was set up, and no one has ever questioned whether this is still needed, or guard design prohibits on-the-run inspections, etc.
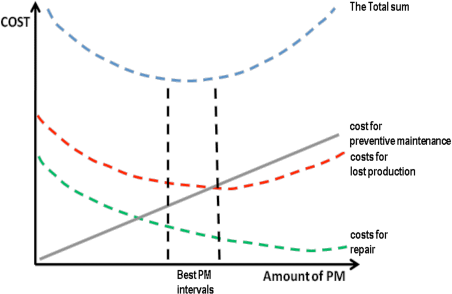
The top total curve in Figure above is the sum of the other curves and shows what the optimum level of maintenance should be.
With this improved maintenance philosophy, the level of planned and scheduled corrective maintenance will increase to over 80% and total maintenance volume and costs will go down 20% to 30%.
More significantly, reliability will improve and production throughput will be faster. This results in lower costs for lost production. And, because preventive maintenance activities are cost-justified based on failure-developing periods and failure distribution in time, total costs are continuously decreasing.
For many companies, optimization represents a long-term goal at best. Maintenance folks at these companies feel caught in a never-ending struggle to dig themselves out from under an ever-growing backlog. The pattern is familiar -– lack of time or technicians to deal with the problems, a shrinking budget, pressure from operations for improved service, and a growing pile of planned and preventive maintenance work that’s ignored or completed in a rush. For these companies, the strategy is simply finding ways to increase the proportion of work that is planned.